Bad Endorf Digital Twin
Visit live site ↗An interactive 3D digital twin of Bad Endorf, a spa town in Bavaria: open map data on real terrain, combined with live weather, air quality, sun position and public transport.
Client
Personal project
Type
Digital Twin · Civic Tech
Role
Concept. Design. Build. Data Integration
Year
2026
Overview
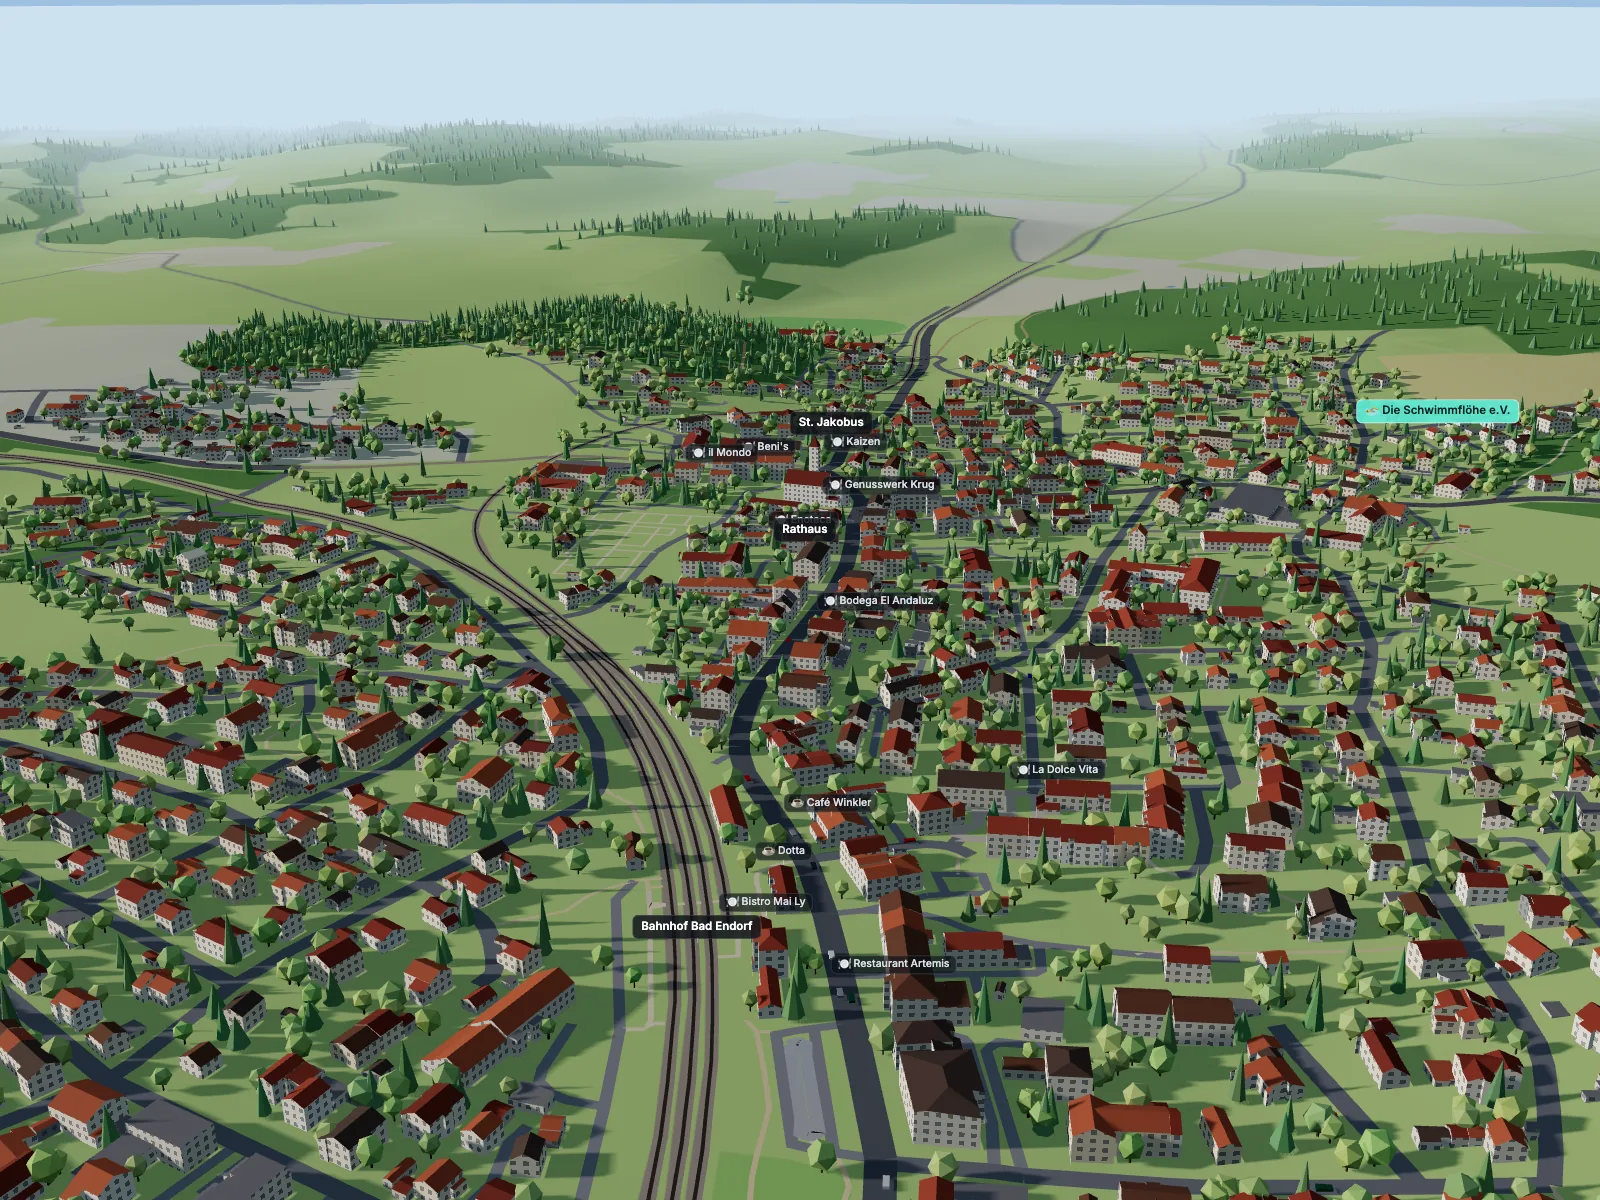
Bad Endorf is my village, a small spa town in the Chiemgau region of Bavaria. This project turns it into a browser-based digital twin: a 3D model of the town built entirely from open data, kept in sync with what is happening there right now.
Visitors can explore 2,289 buildings on real terrain, inspect any building, watch trains arrive at the station at their real times, and see the town under the current weather, air quality and position of the sun. It runs in any modern browser, with no plugins, accounts or API keys.
Process
Buildings come from the official 3D building models of the Bavarian surveying administration (LoD2, open data under CC BY 4.0): real roof shapes and measured heights for every building, updated weekly. A small Python pipeline converts the CityGML files into compact local coordinates and joins each building to OpenStreetMap for names and addresses. Streets, the railway, water, forests and surrounding villages come from OpenStreetMap, and elevation from the Copernicus GLO-90 terrain model, so everything sits on the real hills between Simssee and Langbürgner See.
On top of that sit live data layers, all from open services: weather and air quality from Open-Meteo (CAMS), the sun position calculated for the town's coordinates, and trains and buses from Transitous, an open public-transport API built on the German DELFI timetable and real-time data.
Honest about what is real and what is estimated
A digital twin should say where its data comes from. The first version used OpenStreetMap alone, where most buildings have no recorded height, so heights and roofs had to be estimated. Switching to the official LoD2 models replaced those estimates with measured heights and surveyed roof shapes, added around 1,000 garages and outbuildings missing from OpenStreetMap, and gave every building an official use. The building inspector shows the official use code, roof type and the date of each building's 3D model, and a data mode colours the town by that date.
The same principle applies to transport: regional trains are shown with live delays, while through trains and most buses only have timetable data. Every label states which kind of data it is based on.
Connecting the twin to the municipal heat plan
Bad Endorf completed its municipal heat plan (Kommunale Wärmeplanung) in 2026. Its supply areas exist only as maps in the final report, so I georeferenced the published figure automatically against the municipal boundary and traced the areas into the twin. A Wärmeplan view colours every building by its area, from existing heat networks to network expansion in 2030, 2035 and 2040 and decentral supply, with a timeline that shows the network growing. The layer is clearly marked as traced and not official. The heat plan and heating-fuel views are available as a protected demo on request; the public version shows the solar and heat-island views.
Energy and climate layers
Three further views put the heat plan in context. Zensus 2022 data on the 100 m grid shows how homes heat today: in Bad Endorf, heating oil dominates by far, with district heating clearly concentrated where the existing network runs. A solar view computes the annual irradiation of every roof surface from the official 3D roofs, the real sun path and shading by neighbouring buildings, using the same assumptions as the heat plan. A Landsat satellite measurement from a hot August day shows how strongly the built-up centre heats up compared with the surrounding fields and forest.
Scaling up: the Chiemgau region
A second view widens the twin to 38 × 38 km around the Chiemsee: 157,810 official LoD2 buildings, reduced from 2.5 GB of CityGML to 16 MB of 2 km tiles that stream in around the camera, on real terrain with lakes, forests, villages and the Chiemgau Alps. Trains, buses and Chiemsee ships move across the whole region, and a Landsat mosaic shows where towns and industrial areas heat up in summer. Bad Endorf stays the detailed deep-dive, one click away.
Built to be explored
A guided tour introduces the town, a time slider and timelapse replay the day, weather can be switched for comparison, and every view can be shared as a link that restores the camera, selection, time and data mode. Building data modes (height, use, data date) use a colour palette validated for colour-blind readability. The interface is in German.
Outcome
The result is a lightweight, fully client-side digital twin that combines static open geodata with live weather, air-quality and public-transport feeds, and works on desktop and mobile.
It is a compact demonstration of the approach I bring to smart city and civic tech work: bringing together open, multi-source spatial data, being transparent about data quality, and turning it into a public interface that is clear and engaging. The same building blocks scale to city pilots, mobility dashboards and public engagement tools for urban development projects.
Let's work together.
Building a digital presence that needs to stay clear, accessible, and up to date? I design and build digital experiences that connect content, context, and place — from websites to map-based interfaces — and support communication over time.
→ tim@poggemann.de